
What is SEO?
How to interpret your Google Analytics report and make strategic decisions for your business.
So you now have a website and you are getting monthly Analytic reports telling you where your website stands in the World Wide Web. But what does this mean? Who knows what the visitor flow is and how to analyse these stats and make tactile decisions regarding your website?
We decided to give you a little help and explain some of the main features to look out for when reviewing your SEO. So lets start at the very beginning, a very good place to start….
SEO stands for “search engine optimization.” It is the process of getting traffic from the search results on search engines.
All major search engines such as Google, Bing and Yahoo have primary search results (or Organic rankings), where web pages and other content such as videos, social media or local listings are shown and ranked based on what the search engine considers to be the most relevant to its users. (Payment isn’t involved, as it is with paid search ads.)
So now that we know what it means, lets dig a little deeper under the hood.
1. The Overview
This brief overview provides you with a snapshot of your main Key Performance Indicators. Namely total visits, visit duration, number of pages visited, unique visitors, bounce rate and so forth. If this is all you look at then that’s at least enough to give you a better idea of how your website is performing as it provides you with how many people are visiting your site, what they are looking at and how long they are staying on your site, which is very useful.
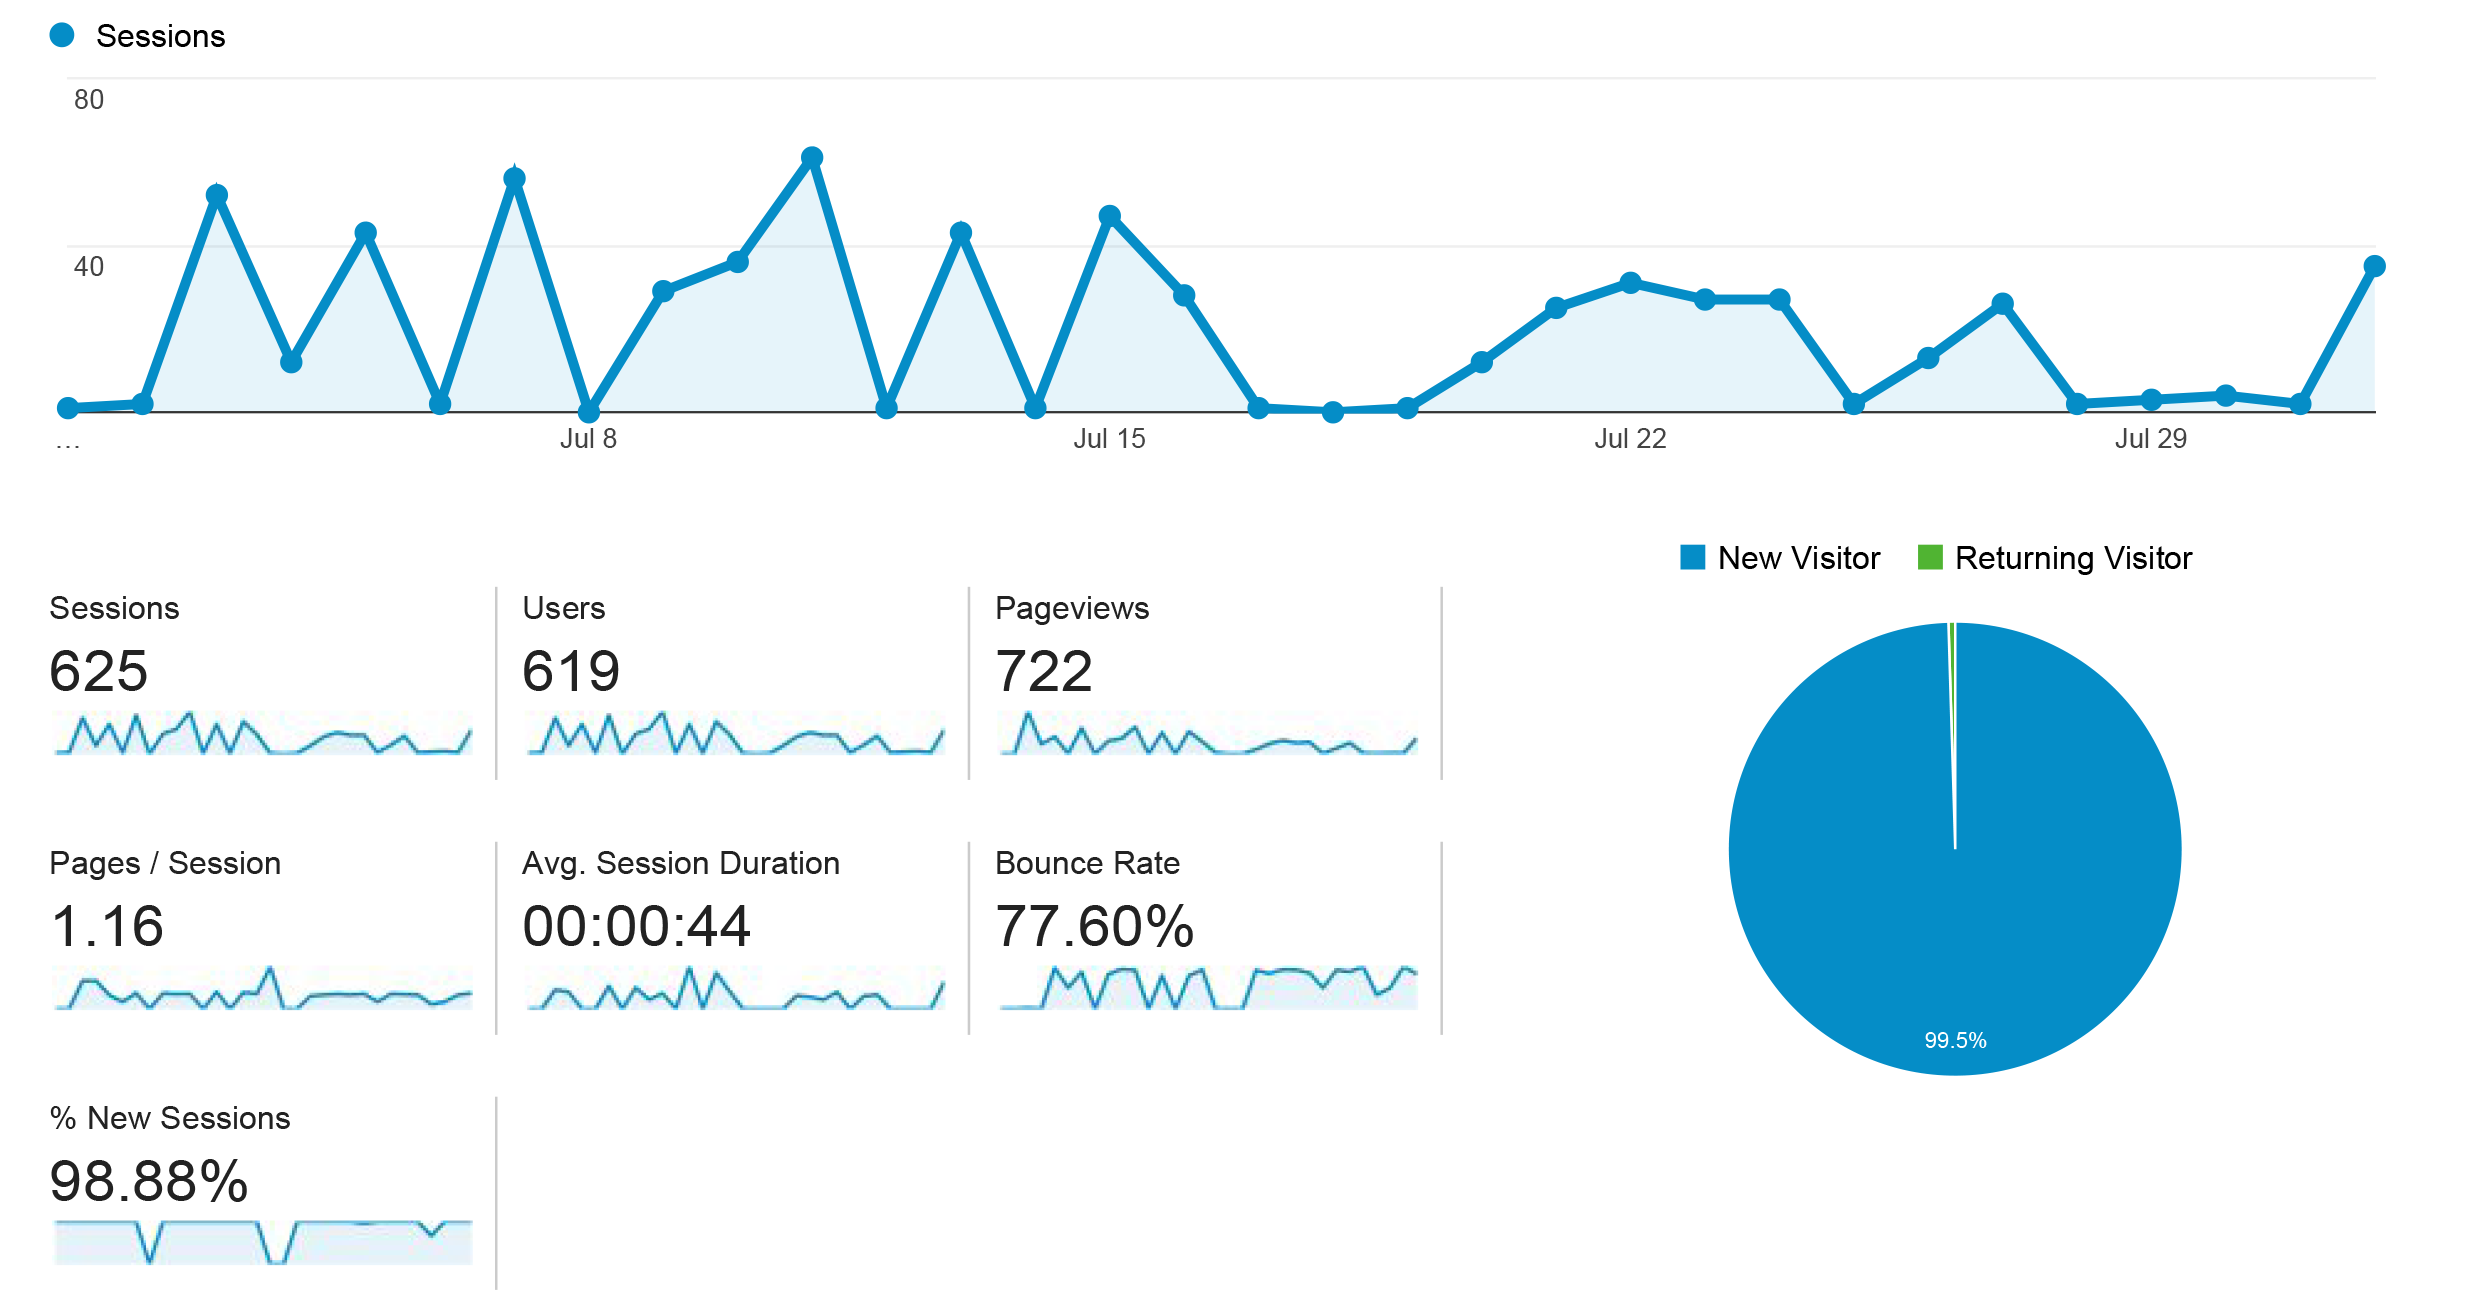
2. Total Visits
If you dig a little deeper you can break down the actual visits to your site by viewing this chart.

The above chart indicates the daily traffic over the last month and can be compared to the previous month (or any time frame you wish). This will enable you to track the peak and off peak days and assess what occurred in your business at that point to produce that result. Possibly a Facebook Post, or a newsletter or maybe an event that you hosted increased the traffic. You can even break it down to the day of the week so you can establish if your website is searched more on weekends or during the week. This will help you plan your digital marketing.
3. Traffic Sources
Now that we know when and how many people are visiting your site, we can investigate where the traffic is coming from.
Traffic sources are broken down to 4 main categories:
- Direct traffic – People simply typed in your website address
- Search Traffic – People found you via Google, Bing, Yahoo
- Referral Traffic – This could be your bulk mailer system such as Mailchimp or an online directory listing.
- Social Media – Facebook, Twitter, LinkedIn etc.

Based on this info, you can establish where the most traffic is coming from. So if it’s coming from Social Media, then you should consider doing more posts or even promoting posts on Facebook. Your top traffic source will depend on your business industry. For example a chemical engineering company is not likely to get traffic from social media but rather from direct traffic.
4. Visitor Flow
Now that we know how many people came from where and when, lets see what they do once they are on your website.

This flow chart explains where the user came from, where they landed and what they did after that. We ideally want visitors to have 5+ interactions with the site, but the average is 3 interactions per user. So ultimately you need to ensure that the most important pages of the site are in their 1st, 2nd and 3rd interaction.
If this is not the case then consider changing your navigation menu, or by placing more “Calls To Action” around the site to promote the key pages of your site.
5. Device
This has only become relevant in the last year or so since Google added “mobile friendly website” as a prerequisite to be ranked.
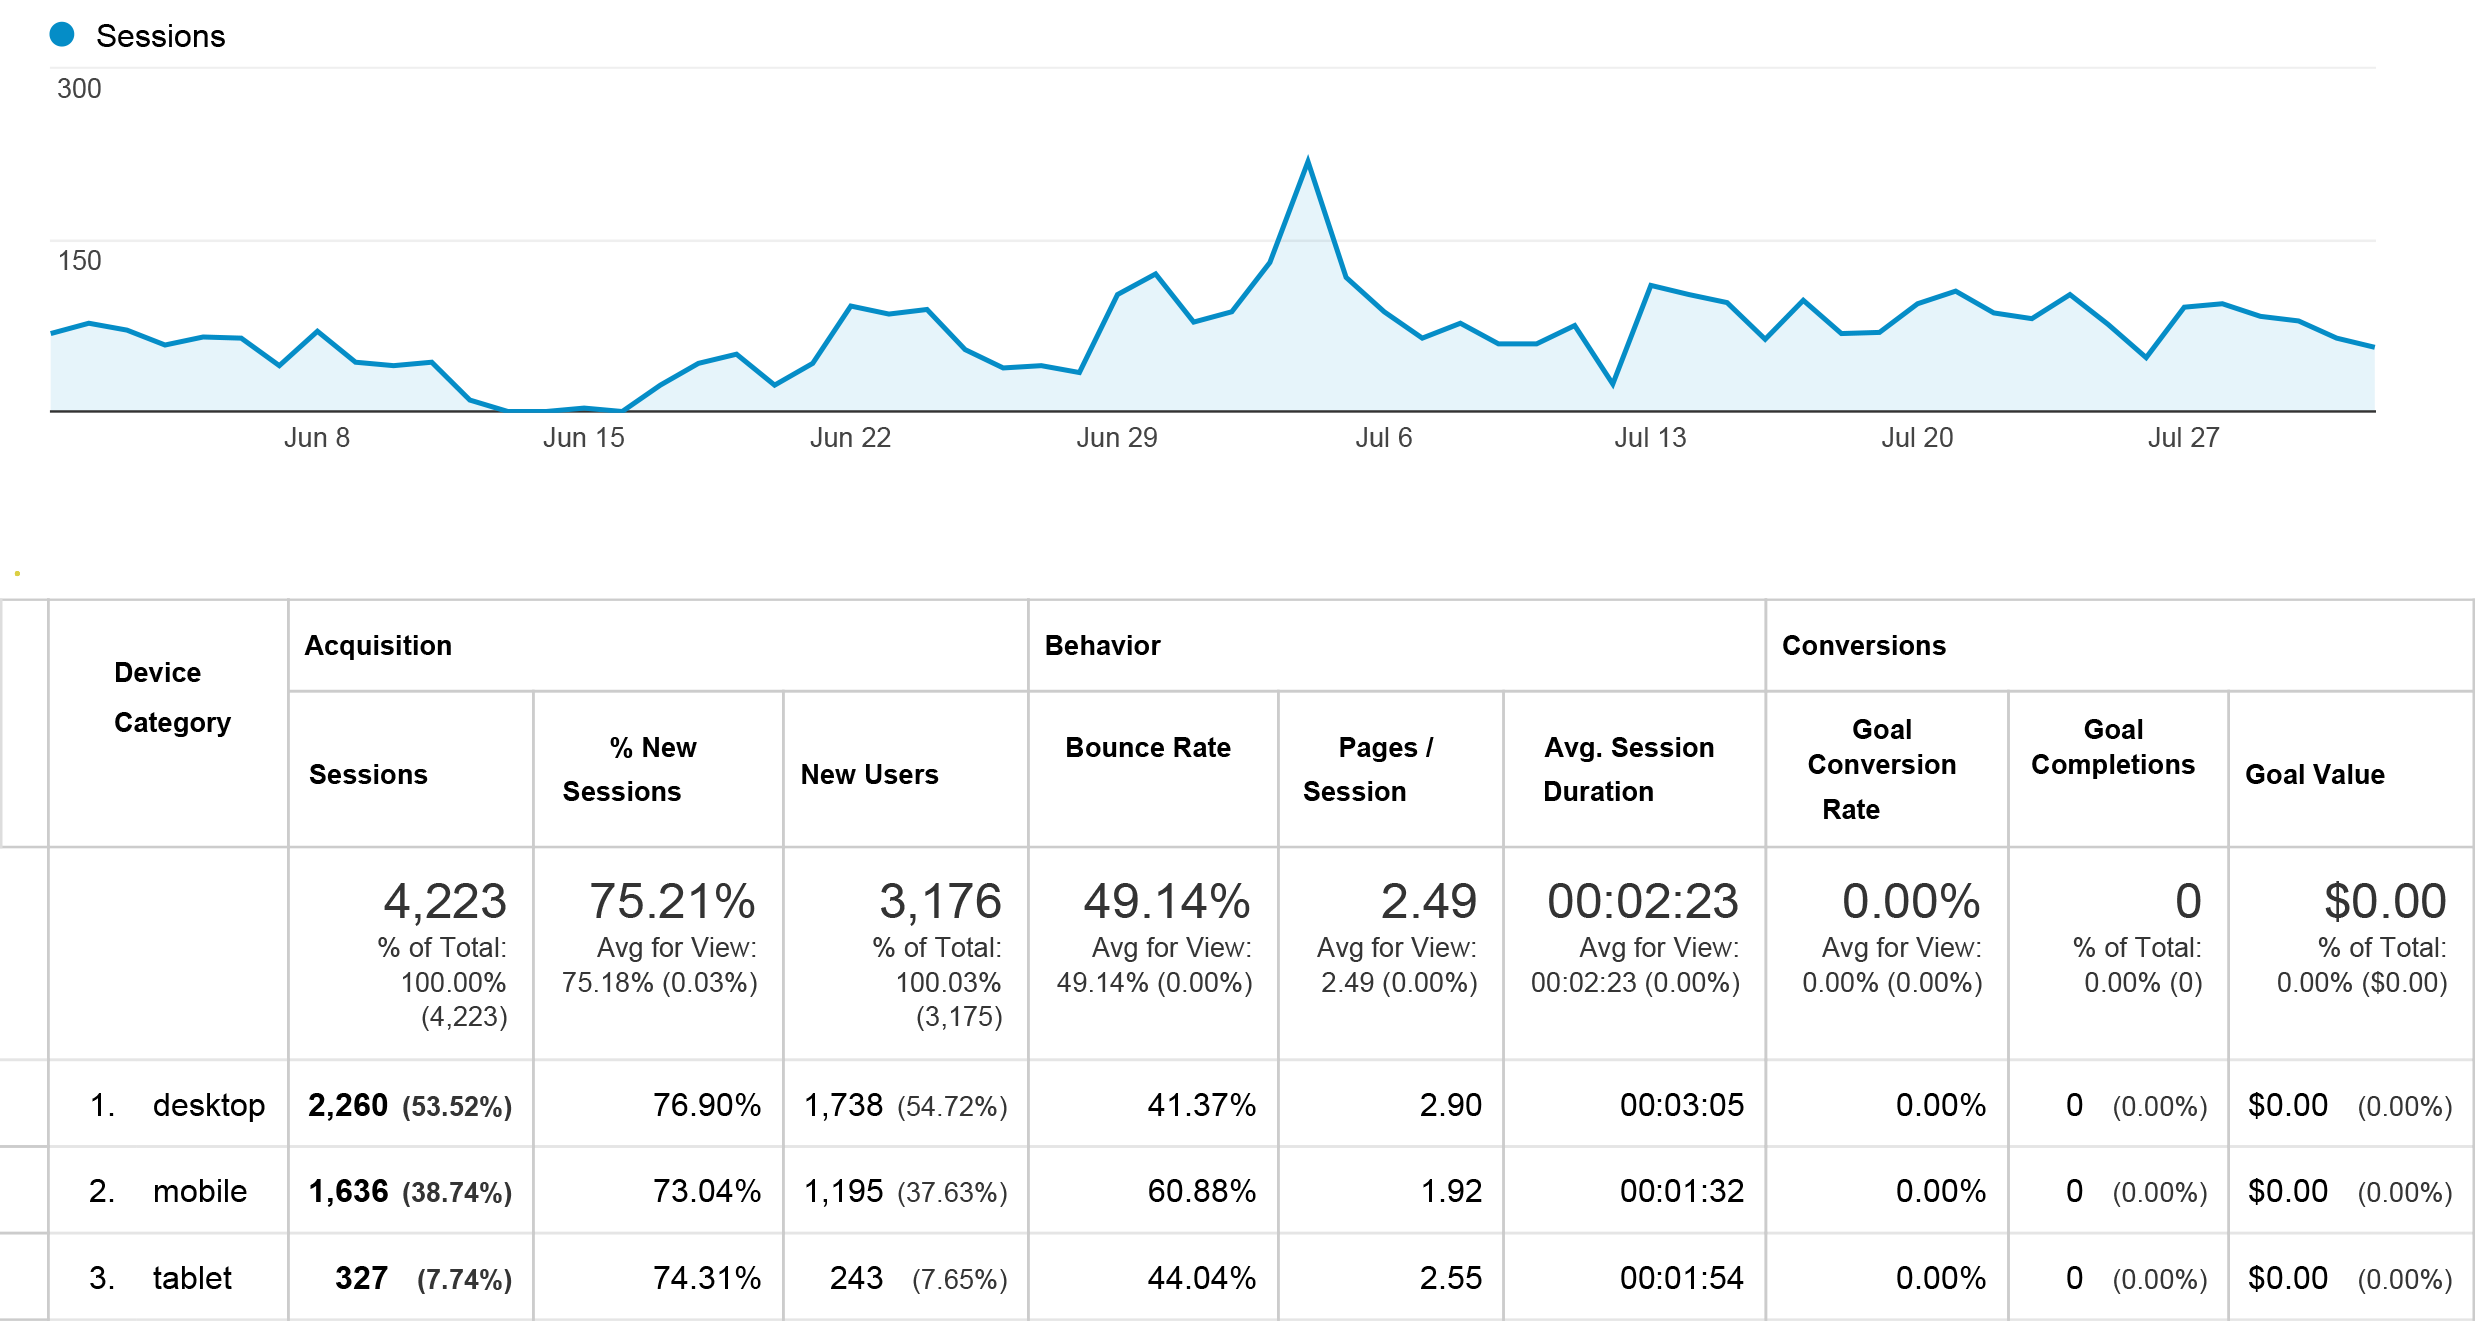
This chart is fairly simple as it tells what device the user viewed your site on i.e.: Tablet, desktop or mobile phone. If most of your viewers use mobile, then you need to ensure that all your content is mobile friendly, loads fast and is not image heavy. Also ensure your communications punting your website are responsive too.
Conclusion
Every website is different and every business is run differently, however we all have 1 thing in common – The Search Engine. These engines rule the roost and control all the algorithms that produce search results, so getting to know your analytics is vital in this digital age. If you don’t get ranked, you won’t be found. Its as simple as that!
Knowing your analytics is vital in this digital age. Not ranked, Not found. Its that simple! Share on X
If you need advice on SEO Reporting or want in depth analysis of these stats for your business, then click here. Banter provides an in-depth analytics report for all our websites, where we provide summaries and recommendations based on these stats, allowing you to make educated and tactile decisions to increase engagement, traffic and ultimately increase leads!
The Periodic Table of SEO
Thanks to www.searchengineland.com for some of the info and this Impressive Graphic of “The Periodic table of SEO Success factors.”
This will offer some more info and explain the basics of SEO and how you can maximize your ROI.
